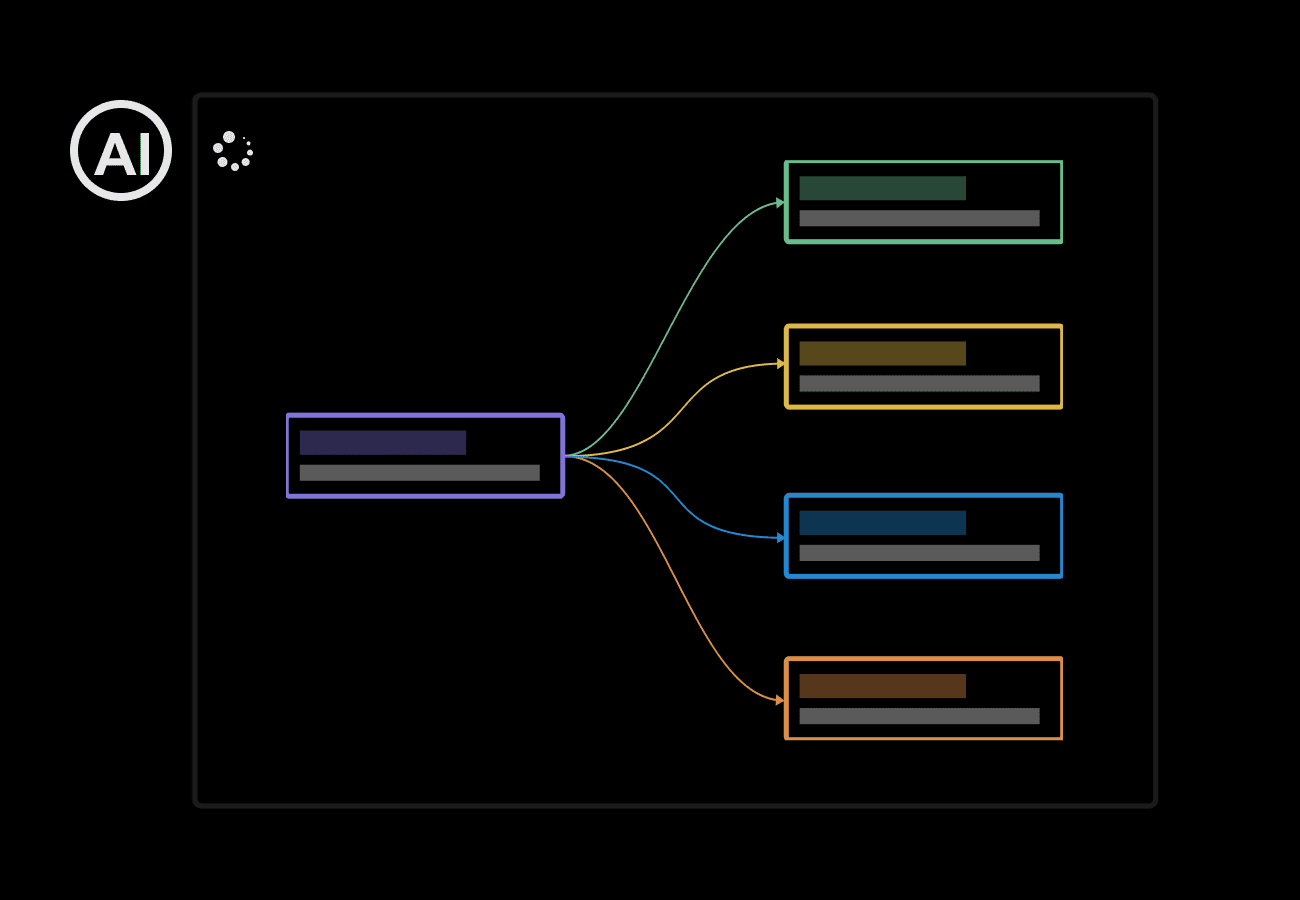


How to create tables and charts using AI
Generate professional tables and charts effortlessly with AI assistance, saving time and effort.

Input your data
Type in your data or upload a file containing the information you want to visualize.

Refine the output
Adjust the AI-generated table or chart by providing additional prompts or specific requirements.

Export and Share
Download your table or chart as a PNG file or share it online with a unique URL.
Why choose MyMap's AI Table & Chart Maker?
AI-Powered
Create tables and charts by simply chatting with AI. No manual formatting or data entry needed - just describe what you want.
Versatile Input
Import data from various file types. Our AI extracts and organizes information to generate tables and charts instantly.

Up-to-Date Data
Access real-time information from Google and Bing. Your tables and charts will always reflect the most current data available.
Web Integration
Add any URL, and our AI will pull relevant data to populate your tables and charts in seconds.
Team-Friendly
Work on tables and charts together in real-time. Perfect for group projects and collaborative data analysis.
Easy Sharing
Export your creations as images or PDFs, or share a simple link. Present your data visually in just a few clicks.
Use Cases

Data Analysts
Data analysts use this tool to quickly transform raw data into visually appealing tables and charts, saving hours of manual formatting for client presentations.

Content Creators
Bloggers and journalists leverage the AI to generate professional-looking tables and charts in seconds, enhancing their articles with data visualizations effortlessly.

Business Managers
Managers utilize this tool to create clear, impactful tables for reports and meetings, turning complex data into easily digestible visual information for stakeholders.
FAQs about Free AI Table & Chart Maker
Is the Free AI Table & Chart Maker really free to use?
Yes, the AI Table & Chart Maker is completely free to use. You can create as many tables and charts as you want without any cost.
How does the AI Table & Chart Maker work?
The AI Table & Chart Maker works by allowing you to input your content or data into a content box. Then, you simply click on 'Generate Table with AI,' and the tool will create your table or chart in seconds. The AI does all the work of arranging and formatting for you.
Can I customize the tables and charts after they're generated?
Yes, you can customize your tables and charts after generation. The tool provides you with the HTML code, which you can edit to adjust details like width, height, color, and more. You can also add or remove values as needed.
Are there any limitations on the type of data I can input?
No, there are no significant limitations on the type of data you can input. The AI Table & Chart Maker can handle both short and long values, making it versatile for various types of information.
How can I use the generated tables and charts in my own content?
After generating your table or chart, you can copy the provided HTML code. This code can then be pasted into any content where HTML is supported, allowing you to easily integrate your tables and charts into websites, documents, or presentations.
Is there a limit to how many tables or charts I can create?
No, there is no limit. You can generate as many tables and charts as you need using the Free AI Table & Chart Maker.
Do I need coding knowledge to use this tool?
No, you don't need coding knowledge to create tables and charts with this tool. The AI handles the generation process, making it accessible for users without technical expertise. However, basic HTML knowledge can be helpful if you want to make advanced customizations.
