


How to create T-chart using AI?
Create T-charts effortlessly with AI assistance, surpassing manual design tools. MyMap.AI offers superior ease and speed compared to competitors.
1. Input your topic
Type your T-chart topic or upload a file. AI instantly processes your input for visualization.
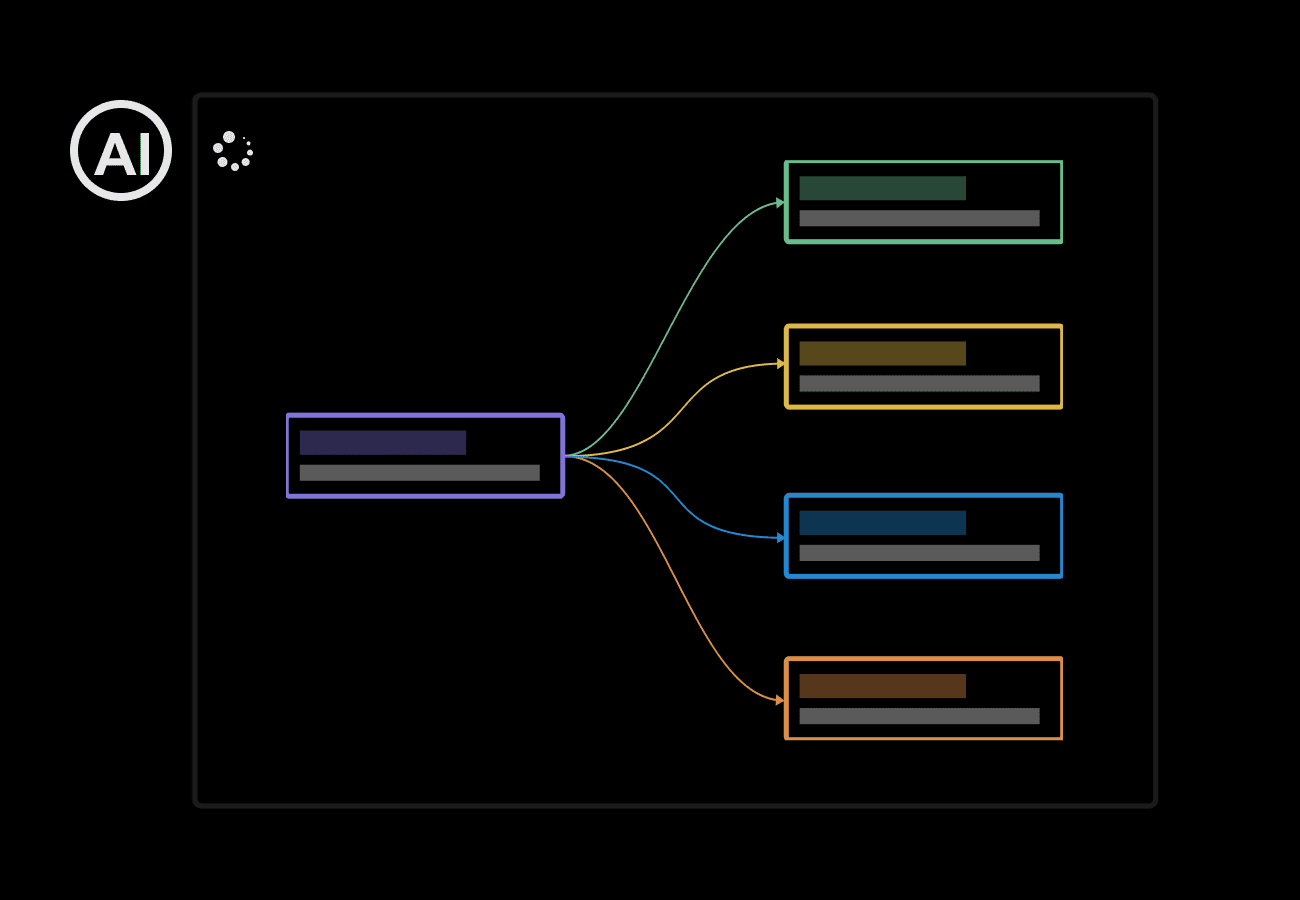
2. Modify AI-generated T-chart
Refine the AI-created T-chart with prompts. Easily add, remove, or reorganize content as needed.

3. Export and Share
Download your T-chart as PNG or publish online with a unique URL for easy sharing.
Why Choose MyMap's T-chart Maker?
AI-Native
Just chat with AI to create T-charts - no need to manually compare by yourself.
Multiple Format
Upload reference files or enter topics you want to compare, and AI creates your T-charts in seconds.

Web Search
MyMap's AI can fetch the most recent info from Google and Bing into your T-charts.
Internet Access
Paste any URL and our AI will browse it for relevant info to create your T-charts.
Collaboration
Team up with coworkers on the same T-chart in real-time.
Share & Export
Save your T-charts as images or PDFs, or just share a link with others.
Use Cases for T-Chart Maker
Students: Analyzing Literature Themes
Students use the T-Chart maker to compare and contrast themes in novels. They list evidence supporting different interpretations on each side, helping them develop critical thinking skills and prepare for essays or class discussions.
Business Managers: Evaluating Project Proposals
Managers create T-Charts to weigh the pros and cons of different project proposals. By visually organizing the advantages and disadvantages, they can make more informed decisions and present their reasoning clearly to stakeholders.
Researchers: Comparing Study Results
Researchers use T-Charts to compare findings from different studies on the same topic. This allows them to quickly identify similarities and differences, spot trends, and generate new hypotheses for further investigation.
FAQs about T-Chart Maker
What is a T-Chart Maker?
A T-Chart Maker is an online tool for creating visual comparisons. It allows users to easily create two-column charts resembling the letter 'T', perfect for comparing ideas, listing pros and cons, or organizing thoughts on a topic.
Is MyMap.AI's T-Chart Maker free to use?
Yes, MyMap.AI offers 5 free daily AI credits. You can create T-charts using these free credits. For premium features and unlimited use, paid plans are available.
Why choose MyMap.AI's T-Chart Maker over competitors?
MyMap.AI creates visual content through AI chat, while competitors often require manual design. Our T-Chart Maker is uniquely user-friendly, allowing you to generate T-charts simply by describing your ideas in a chat interface. This AI-powered approach saves time and doesn't require design skills.
How can I export my T-chart?
You can export your T-chart as a PNG image file. This makes it easy to save, share, or include your T-chart in other documents or presentations.
Can I share my T-chart with others?
Yes, you can share your T-chart. MyMap.AI allows you to share your created T-charts through a public URL, making collaboration and presentation simple and efficient.
What types of comparisons can I make with a T-chart?
T-charts are versatile. You can use them for pros and cons, advantages and disadvantages, facts and opinions, or any other two-category comparison. Simply describe your comparison needs to our AI, and it will generate an appropriate T-chart.
Can I customize the look of my T-chart?
Yes, you can customize your T-chart. While our AI generates the initial chart based on your description, you can then adjust colors, fonts, and layout to suit your preferences or brand guidelines.
Is there a limit to how much information I can include in a T-chart?
While there's no strict limit, T-charts are most effective when concise. Our AI is trained to create clear, readable charts. If you have a lot of information, consider creating multiple T-charts or exploring other diagram types available in the full MyMap.AI platform.
Can I use the T-Chart Maker for team collaboration?
Yes, the T-Chart Maker is great for team collaboration. You can easily share your charts via a public URL, making it simple for team members to view and discuss the comparisons you've created.
How does MyMap.AI's T-Chart Maker compare to traditional spreadsheet tools?
Unlike spreadsheets, MyMap.AI's T-Chart Maker uses AI to understand your needs and automatically create visually appealing charts. This means you don't need to manually format cells or input data – just describe what you want, and the AI does the work for you.