

How to create a spider chart using AI
Create professional spider charts quickly and easily with AI assistance, perfect for data visualization.

Input your data
Type in your data points or upload a file containing the information for your spider chart.

Refine the chart
Use AI prompts to adjust colors, labels, and layout of your spider chart for optimal presentation.

Export and Share
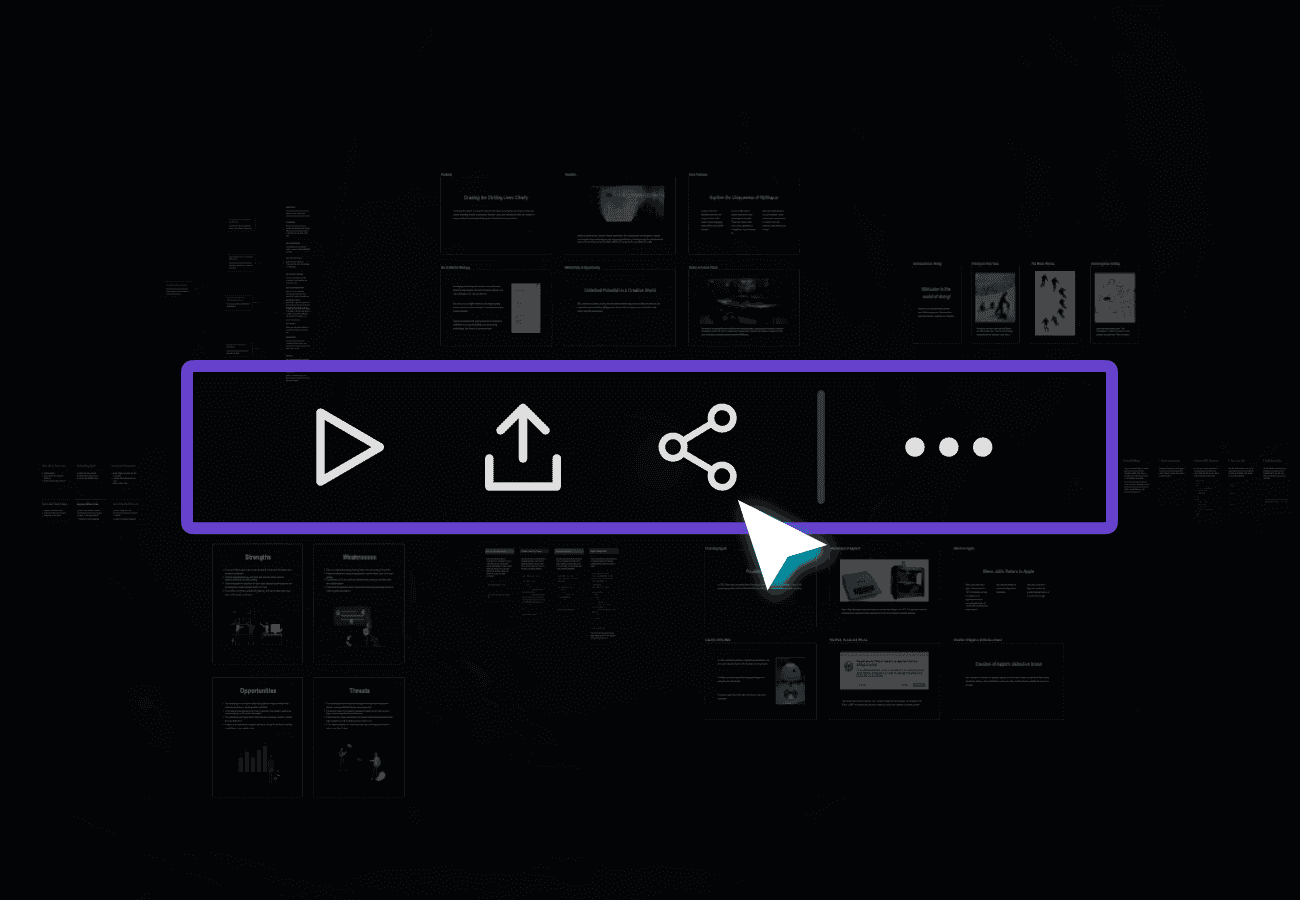
Download your spider chart as a PNG file or share it online with a unique URL.
Why choose MyMap's Spider Chart Maker?
AI-Powered
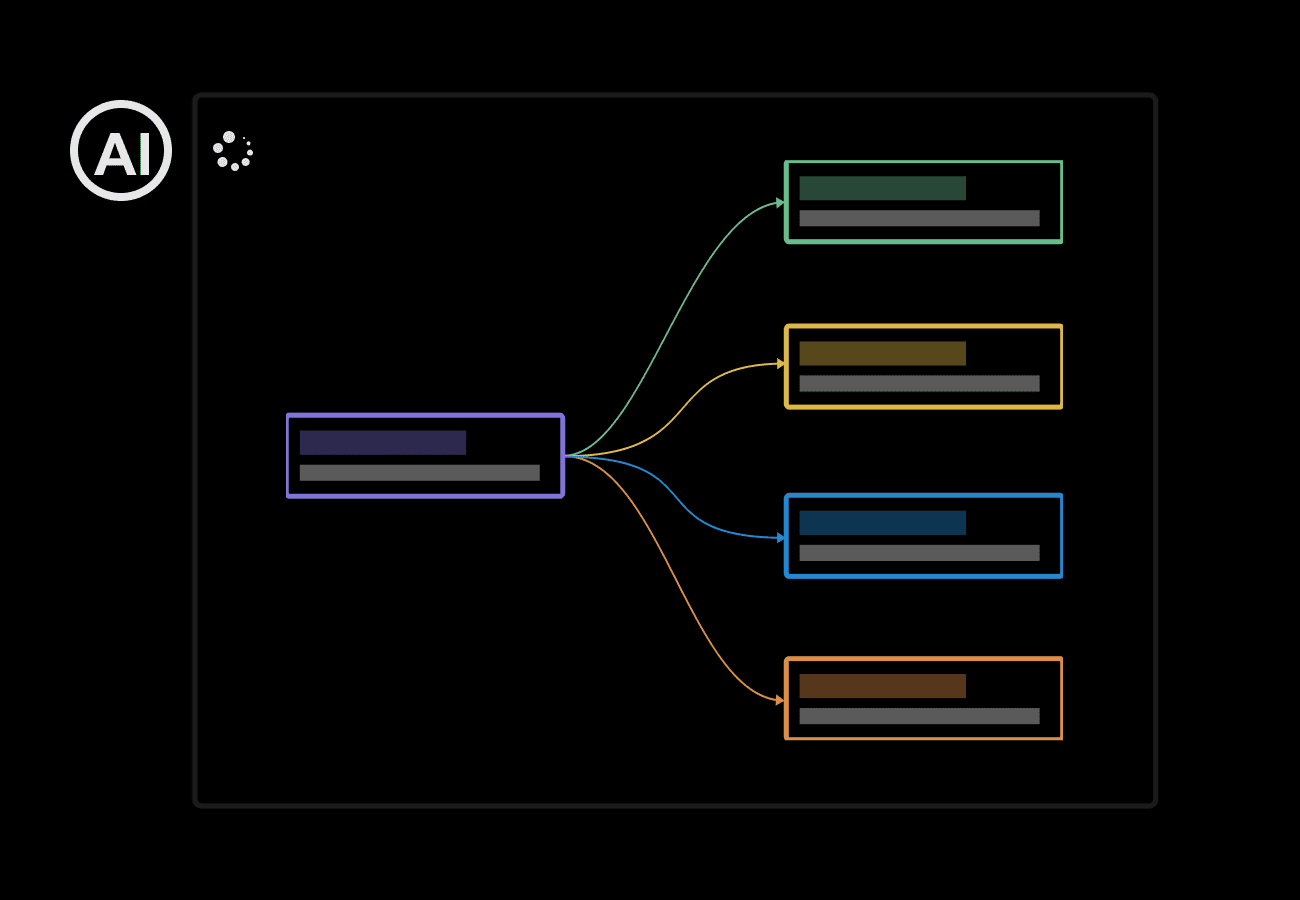
Create spider charts by simply chatting with AI. No need to manually plot points or fiddle with complex tools.
Versatile Input
Import data from various file types. Our AI analyzes and transforms your content into a visually appealing spider chart.

Up-to-Date Data
Our AI searches the web to fetch the latest information, ensuring your spider charts reflect current trends and statistics.
Web Integration
Just paste a URL, and our AI extracts relevant data to create your spider chart in seconds.
Team-Friendly
Work together with colleagues on the same spider chart in real-time, boosting productivity and fostering collaboration.
Easy Sharing
Export your spider charts as images or PDFs, or share a link for quick and convenient distribution.
Use Cases
Business Analysts
Analysts use this tool to create competitive landscape spider charts, quickly visualizing market positions and strategic opportunities for informed decision-making.
Product Managers
PMs utilize the AI spider chart maker during brainstorming sessions, rapidly mapping out product features and customer needs to prioritize development efforts.
Students
Students create spider diagrams to summarize complex subjects before exams, effortlessly organizing key points and subtopics for effective revision and retention.
FAQs about Free AI Spider Chart Maker
What is a spider chart and how can it be used?
A spider chart, also known as a spider diagram or radar chart, is a visual tool for organizing and structuring ideas or information. It typically has a central topic with related subtopics branching outwards in a radial pattern. It's useful for strategic analysis, brainstorming, ideation, learning, and revision.
Is the AI Spider Chart Maker free to use?
Yes, our AI Spider Chart Maker is free to use. We offer a free online tool that allows you to create spider charts effortlessly, helping you map out concepts, brainstorm ideas, and create clear connections between thoughts.
How do I create a spider chart using this tool?
Creating a spider chart is simple: 1) Start by entering a central topic. 2) Draw lines outward from the central concept. 3) Add subtopics on each line. 4) Organize your thoughts by extending more lines from subtopics and adding details as needed. Our AI-powered tool guides you through this process, making it easy and intuitive.
Can I customize my spider chart?
Yes, you can customize your spider chart. Our tool offers various options to personalize your chart, including different colors, fonts, and styles. You can adjust the layout, add or remove branches, and modify the content to suit your specific needs.
How can I save or share my spider chart?
Once you've created your spider chart, you can save it in various formats, including PNG image format. You can also share your chart easily through a public URL, making it simple to collaborate with others or include in presentations and documents.
What advantages does the AI Spider Chart Maker offer over manual creation?
Our AI Spider Chart Maker offers several advantages: it's faster and more efficient than manual creation, provides intelligent suggestions for subtopics and branches, ensures consistent and professional-looking results, and allows for easy editing and real-time collaboration. It streamlines the entire process, saving you time and effort.
Can I use this tool for educational purposes?
Absolutely! Our AI Spider Chart Maker is an excellent tool for educational purposes. It can be used for studying, summarizing topics, organizing lecture notes, planning research papers, and visualizing complex concepts. It's particularly useful for visual learners and can enhance understanding and retention of information.
