


How to create charts using AI
Create professional charts quickly and easily with AI assistance, no design skills required.
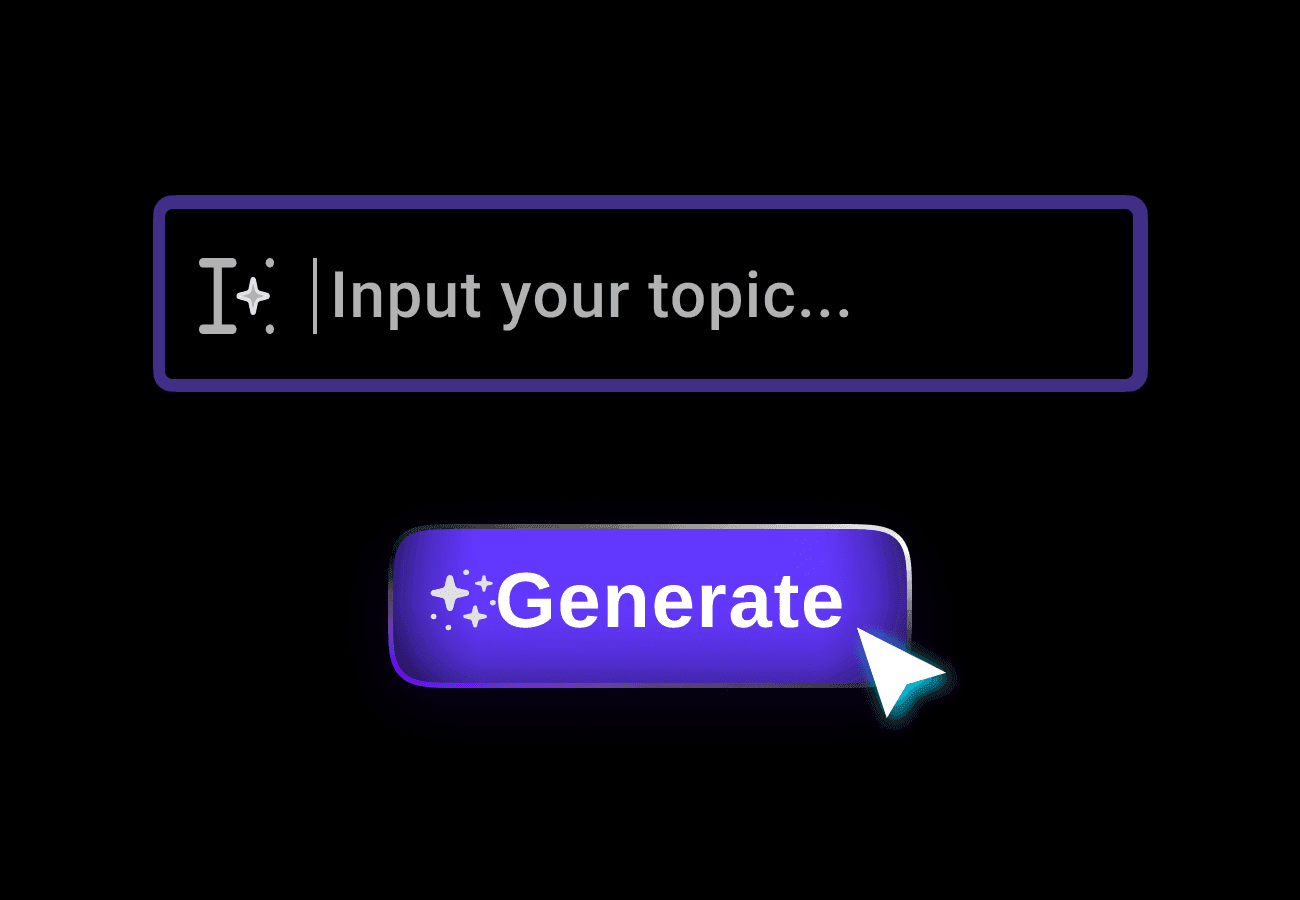
Input Your Data
Type in your data or topic for the chart. AI will process your input and suggest suitable chart types.
Refine the Chart
Use prompts to adjust colors, labels, or chart style. AI will update the chart based on your instructions.

Export and Share
Download your chart as a PNG file or share it online with a unique URL for easy collaboration.
Why choose MyMap's AI Chart Maker?
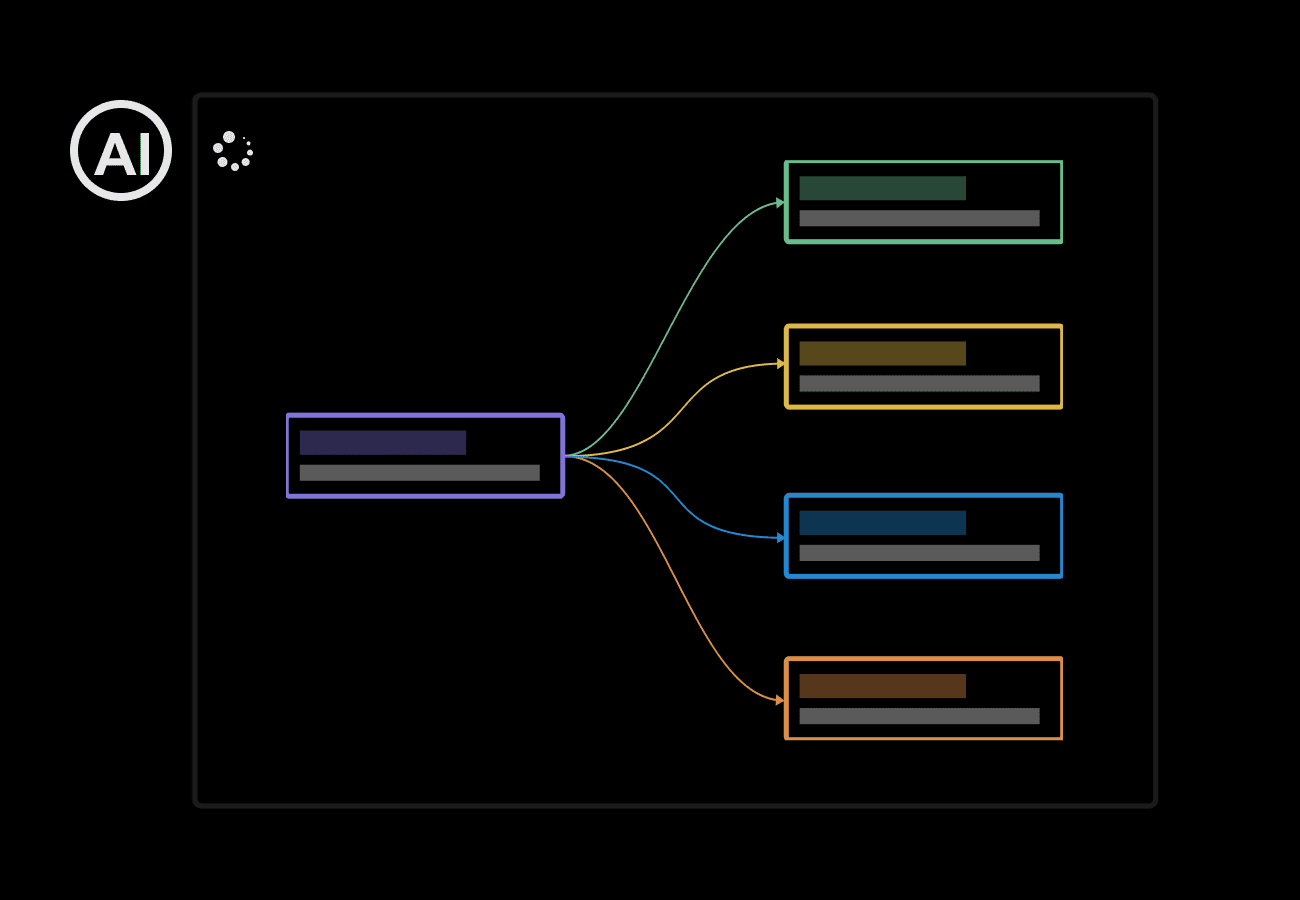
AI-Powered
Chat with AI to create charts in seconds. No manual tweaking needed - just describe what you want.
Versatile Input
Upload any file type. Our AI extracts data and transforms it into visually appealing charts for you.

Web Integration
Our AI searches Google and Bing to include up-to-date information in your charts, keeping them current.
URL Import
Simply paste a URL. Our AI pulls relevant data to create informative charts from web content.
Real-time Teamwork
Work on charts together with your team simultaneously. See changes as they happen.
Easy Sharing
Export your charts as images or PDFs, or share a quick link. Present your data effortlessly.
Use Cases

Data Analysts
Data analysts use this tool to quickly visualize complex datasets, transforming hours of Excel work into stunning charts within minutes, enhancing their reports with clear, compelling visuals.

Business Professionals
Executives leverage the AI Chart Maker to create impactful presentations, effortlessly generating professional-grade charts that showcase key metrics and trends for stakeholder meetings.

Educators
Teachers utilize this tool to create engaging visual aids for lessons, instantly transforming dry statistics into colorful, easy-to-understand charts that captivate students' attention and improve learning outcomes.
FAQs about Free AI Chart Maker
Is the AI Chart Maker completely free to use?
Yes, our AI Chart Maker offers a free tier that allows you to create charts and graphs. However, there may be limitations on advanced features or the number of charts you can create. For more extensive use, we offer paid plans with additional capabilities.
What types of charts can I create with the AI Chart Maker?
You can create a wide variety of charts including bar charts, line charts, pie charts, scatter plots, histograms, and more. Our AI-powered tool is versatile and can generate the most suitable chart type based on your data and requirements.
How do I input data for creating charts?
You can input data in several ways. You can upload CSV files, link Google Sheets, or even use our chat interface to describe your data. Our AI will then process this information to generate the appropriate chart.
Can I customize the charts after they're generated?
Yes, you can customize your charts after they're generated. You can modify colors, fonts, labels, and other design elements to match your preferences or branding requirements.
Is it possible to export the charts I create?
Yes, you can export your charts in various formats suitable for both digital and print use. Common export options include PNG, PDF, and other high-resolution image formats.
Do I need any technical skills to use the AI Chart Maker?
No, you don't need any technical skills. Our AI-powered tool is designed to be user-friendly. You can create professional-looking charts simply by describing what you want or inputting your data. The AI handles the technical aspects of chart creation for you.
How does the AI ensure the accuracy of the charts?
Our AI is trained to process and interpret data accurately. It follows best practices in data visualization to ensure that the generated charts correctly represent your data. However, we always recommend reviewing the output to ensure it meets your specific needs and expectations.